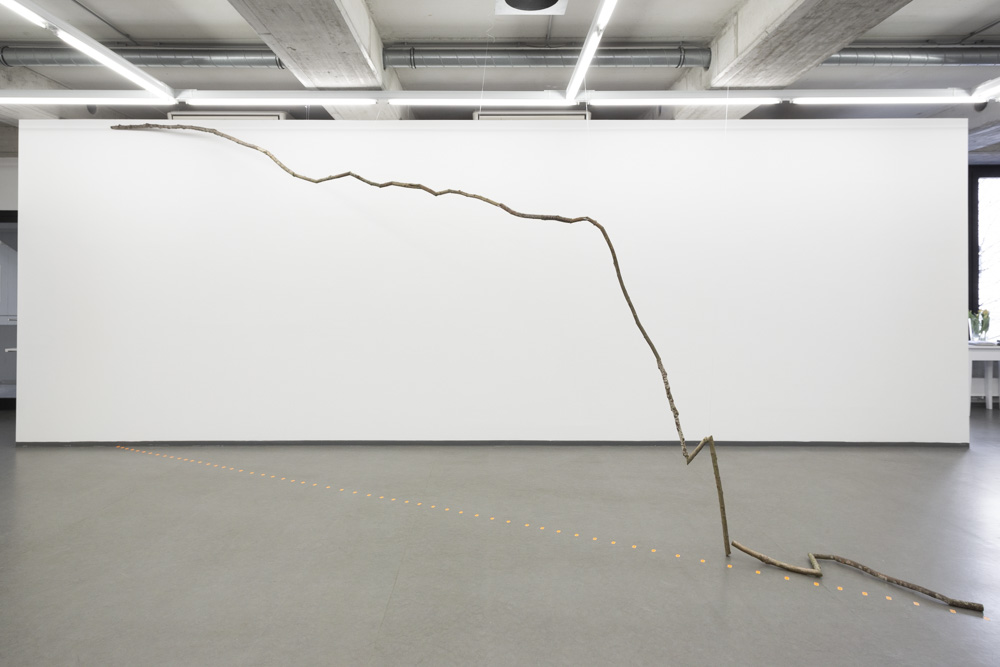
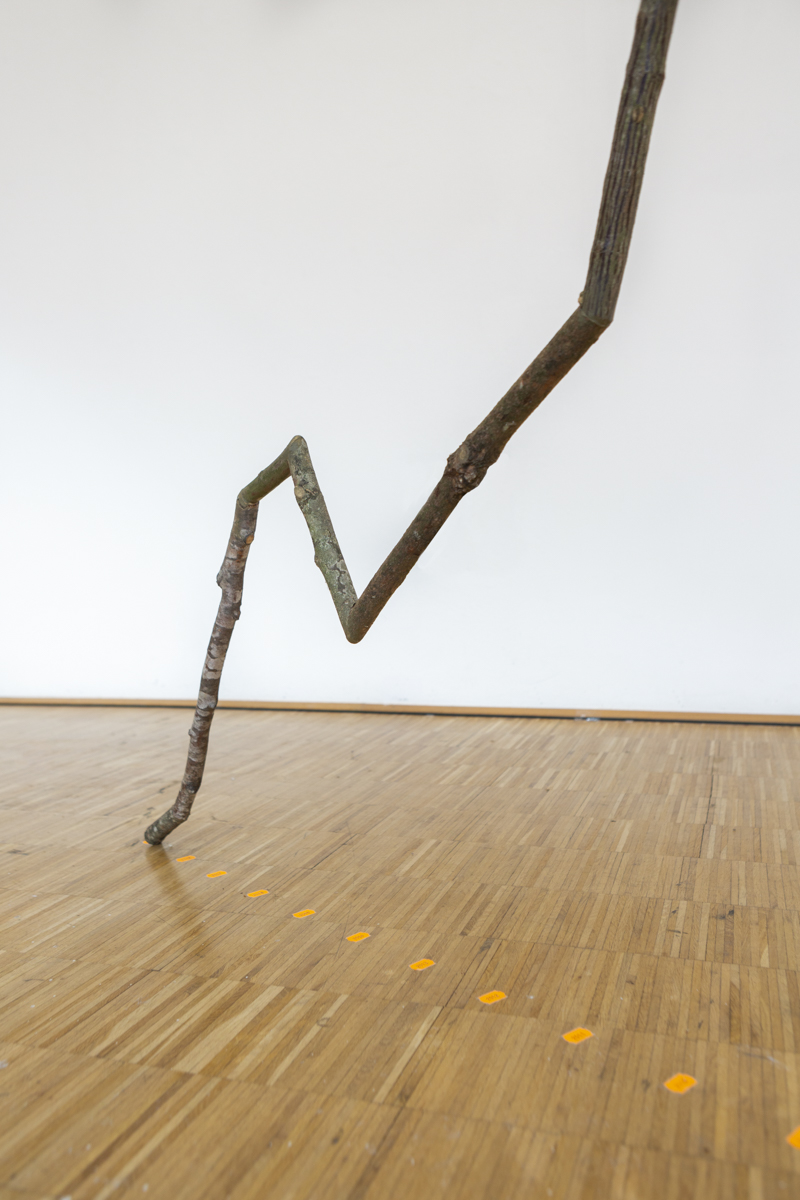
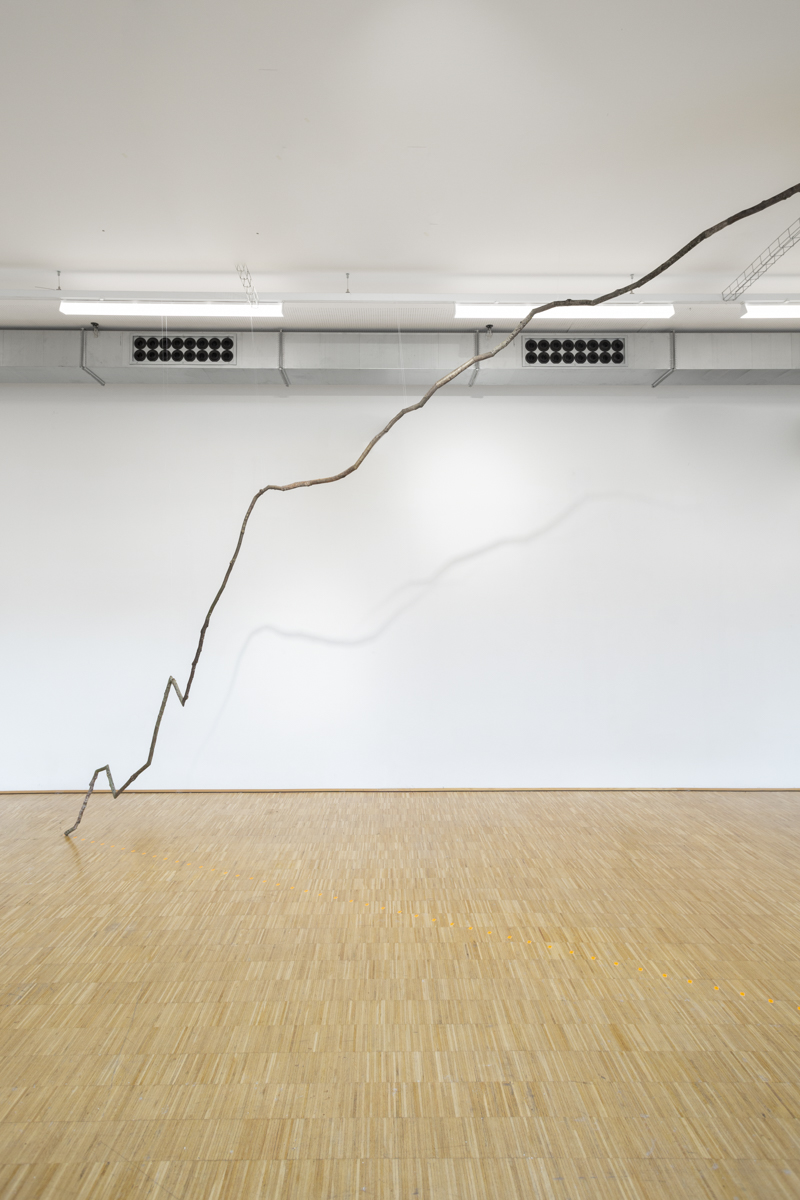
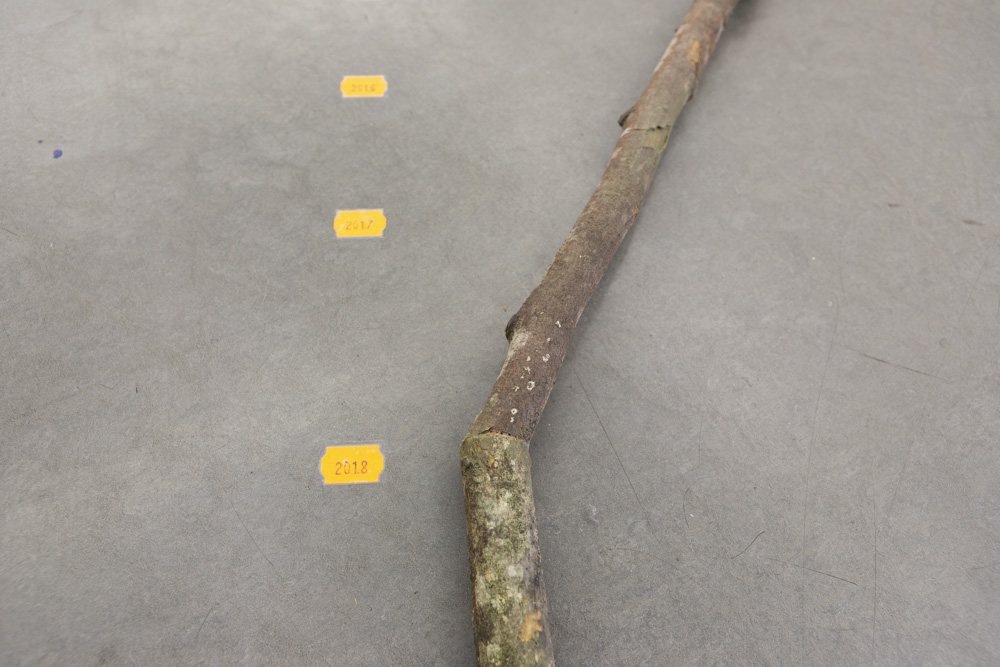
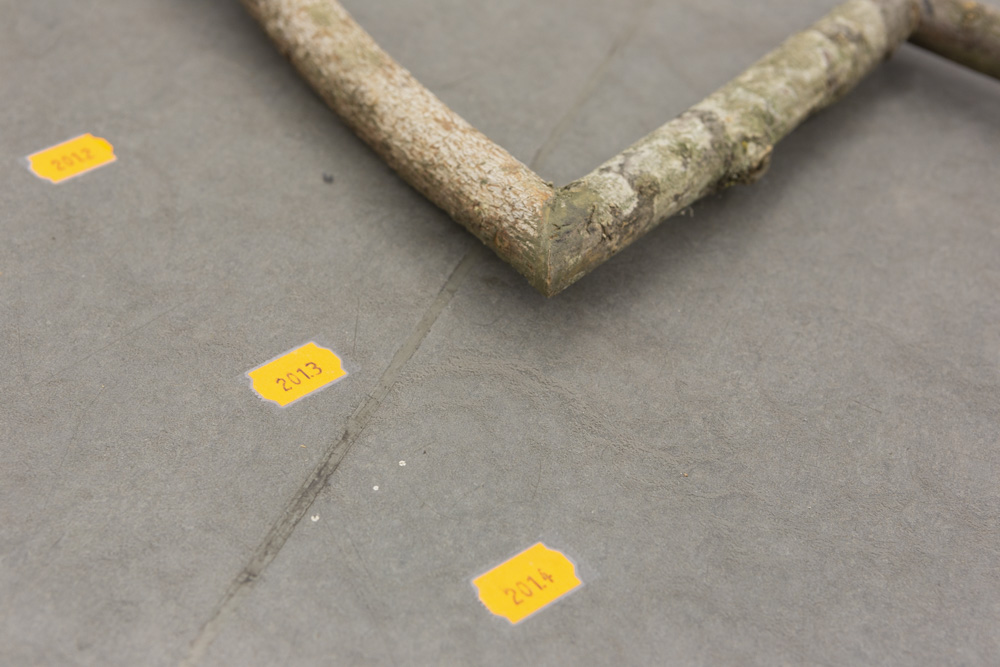
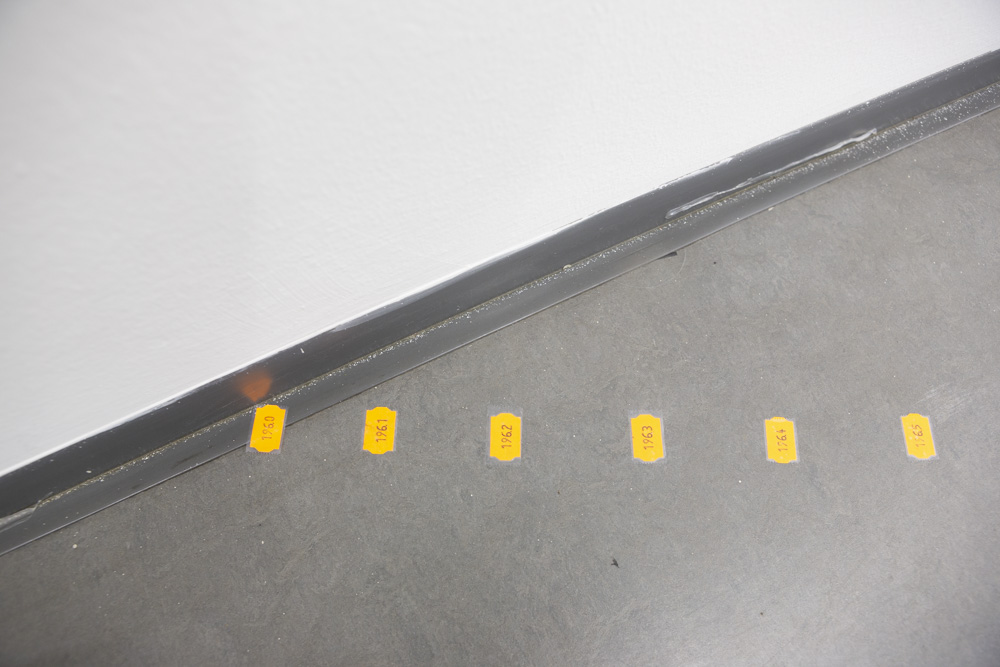
graph sculpture, 2020
adhesive stickers, branches, approx. 6×3,5m
Based on graphical representations of the world-wide gross domestic product from the years 1960 – 2019, this data was transferred into physical space for „Growth“. However, the growth curve just described was turned upside down in the exhibition space, so that the current course from 2019 starts from the floor and the journey visually goes back in time to the 1960s. The respective sections were marked by means of adhesive chains as known from the sales industry.